


On the face of it, the second-quarter Labour Force Survey (LFS) numbers could have been worse. There were around 25,000 more jobs than in the previous three months. Official unemployment numbers fell by some 50,000.
As the graph below shows, there’s been a clear stabilisation in both the narrow and broad rate of unemployment since the global recession, but no conclusive evidence of a recovery in employment numbers. Employment/unemployment figures tend to lag behind the broader economic cycle a bit.
The number of jobs in the economy peaked at 13.8 million in the fourth quarter of 2008. Both the narrow and broad unemployment rates hit their lowest levels in over a decade in this quarter, a good three or four months after the global financial crisis hit. At that time the official measures of narrow and broad unemployment were around 22% and 29% respectively.
Through the whole of 2009, the employment figures reflected a haemorrhaging of jobs and a rise in both measures of unemployment. By mid-2010 the number of jobs appeared to have stabilised at around 13 million, and from mid-2011 it began to increase ever so gently. In the last six to nine months, the LFS has measured around 13.5 million jobs in the economy.
The number of jobs created in the economy is only one side of the employment/unemployment ratio, however. The ebb and flow of the officially unemployed and the discouraged work-seekers in the labour market has seen the official unemployment rate oscillate between 24.0% and 25.5% over the last two years. The broader rate of unemployment has fluctuated in a similar band, between 35.5% and 37%.
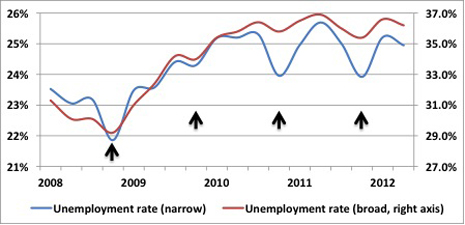
The juxtaposition of the two rates of unemployment highlights at least two interesting trends. Firstly, the seasonal nature of the data can be seen quite clearly at such a precise scale. There is a spike in employment in the fourth quarter of every calendar year, and a concomitant dip in the unemployment rate for that quarter. The effect is more pronounced in the narrow rate of unemployment. It’s quite prominent in the fourth quarters of 2008, 2010 and 2011 and a bit more subtle in 2009.
Similarly, there is a fall in employment in the first two quarters of any calendar year, and a recovery in the third quarter, and then the whole cycle begins again. It’s most pronounced over the last two years. The unemployment rates have virtually sinewaved over these eight quarters.
In the absence of any official seasonal adjustments from StatsSA, let’s suggest that we take a clean average of the peaks and troughs of last two years for both measures of unemployment. That would give us an official unemployment rate of 25% and a broad measure of unemployment at 36% for the last two years, valley deep and mountain high be damned. That’s the second trend.
Similarly, let’s accept that the personal best of the labour market in the fourth quarter of 2008 was a little bit performance-enhanced. It seems more likely that the longer-term trend for unemployment would have been 22.5%, if not closer to 23% in that quarter, and the broader rate of unemployment at 30% and not 29%.
Looking at the data dispassionately, what effect has the financial crisis really had on the labour market (if the official numbers are to be believed)? The official unemployment rate has increased by some 2 – 2.5 percentage points. The broader rate of unemployment has risen by six whole percentage points.
The rise in the official unemployment rate doesn’t look so bad. The increase in the broader unemployment rate looks a lot more alarming. Which measure matters?
The official unemployment rate excludes discouraged work seekers. Some of these might officially re-enter the labour market in the future, armed with new skills and/or hope. Many will not. In the stark divisions of public finance, these discouraged work-seekers are more likely to be net recipients from the fiscus than net contributors.
In terms of their impact on the fiscus, there’s little difference between the officially unemployed (those who have been looking for work and haven’t found it) and the discouraged work-seekers (those who haven’t been looking for work but could work). Some might access social grants and some might survive on the kindness of family, community or strangers, but none will be paying income tax. This is not meant to be a value judgement, just a measure of fiscal stability and sustainability.
In 2008, out of 100 people, about 72 would be able to find a job if they wanted one, and the other 28 would either be looking for a job and not find it or would have given up looking altogether. Since mid-2010, that number has fallen to around 67 out of 100, and the number of people without jobs has risen to 33.
Structurally, the problem of unemployment hasn’t changed much over the last two years. The outlook for South Africa’s main trading partners isn’t pretty, there’s little to recommend in the way of policy changes that could be job- or business-friendly, and there’s scant evidence of improving business conditions in the short-term. The labour market will continue to drift sideways, rising and falling with the seasons. DM
Photo by Reuters.